Reports
Reporting
Reports are interactive charts that track and report on different items in Resolve Actions Pro, such as Runbook executions or server loads. Reports can be found in the Resolve Reports main menu set. The Report Administration menu provides Runbook property options to track the duration and costs of Runbook execution.
The Resolve Reports menu provides these categories of reports:
- Business Reports—Shed insights on time and cost-saving from Runbook, Action Tasks, and Timers.
- Operation Reports—Provide statistics about Runbook execution.
- Admin Reports—Provide system health and status data.
- Development Reports—Provide knowledge base status and Decision Tree execution details.
- Usage Reports—Provide detailed Runbook usage information such as how the Runbook was run and how many times the critical path was taken.
Many of the reports use a common framework of labels and controls. For example, some reports display data taken over a period of time in either a pie chart (shown below) of line graph.
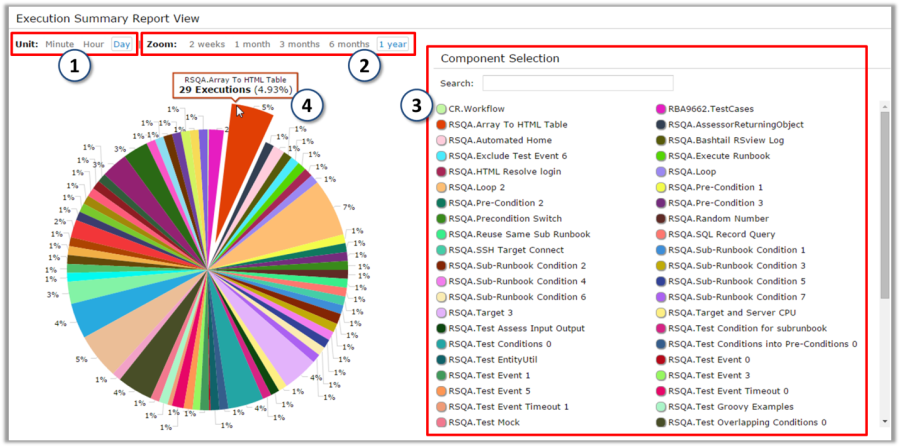
- You can change the time scale with the Unit track to display data by minute, hour, or day.
- Use the Zoom buttons to change the data range, or the length of time in the past to display in the chart. These controls depend on the Unit scale selected:
- With unit Minute, you can see 30 minutes, 1 hour, 6 hours, 12 hours, or 1 day of data.

- With unit Hour, you can see 12 hours, 1 day, 3 days, 5 days, or 1 week of data

- With unit Day, you can see data from the past 2 weeks, 1 month, 3 months, 6 months, or 1 year.

- With unit Minute, you can see 30 minutes, 1 hour, 6 hours, 12 hours, or 1 day of data.
- Use Component Selection to select the data points or data sets comprising the chart display.
- View additional details, such as raw numbers, about individual data points or data sets by clicking the pie chart elements.
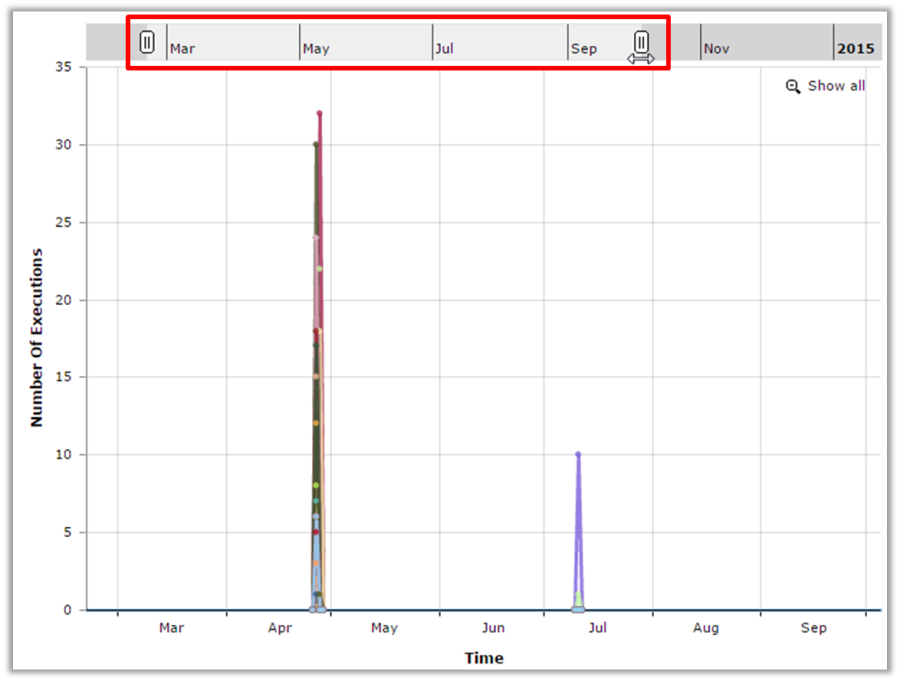
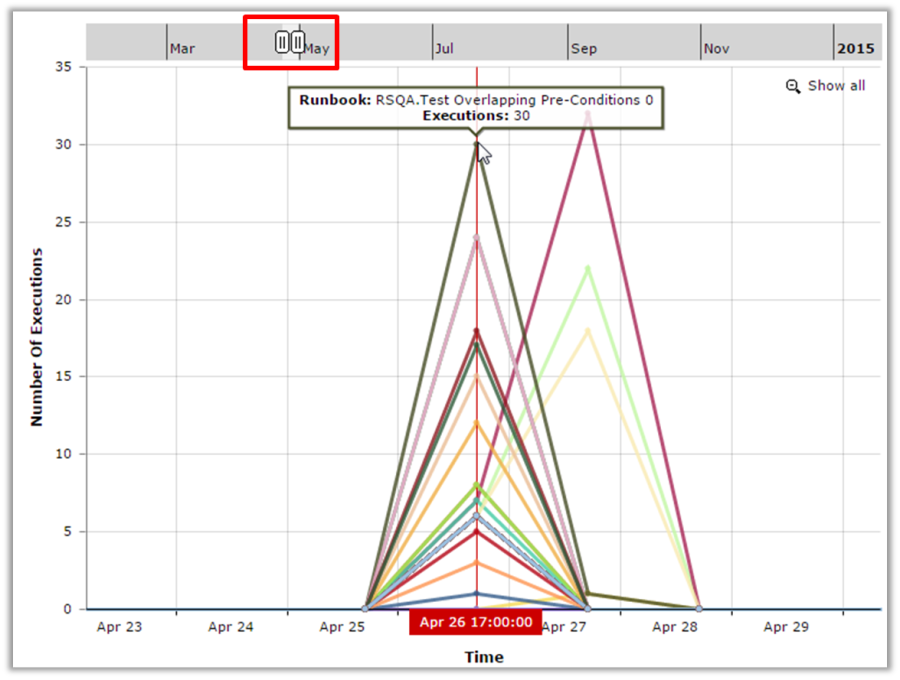
For many line charts, the period of time shown on the graph is set by the Zoom range. However, any section of the line chart can be zoomed in or out with the sliders at the top of the chart. The sliders mark the boundaries of the time period shown in the chart: to focus in on a shorter time period, slide the markers closer together around the desired dates or times to zoom in. Hover over any data point in the chart itself to bring up the raw data values for that data point.
The following figures show the difference between the initial view of an In-line Chart and the zoomed-in view.
Report Administration
The Report Administration main menu enables you to track Runbook duration and execution cost of Runbooks execution with Runbook properties, and various other metrics with MCP (Master Control Process). For Actions Pro users that upgraded from versions older than 5.1, the Report Designer and web-based Management Console functions will also show, so that InetSoft reporting functions can be retained.
Actions Pro 5.1 and newer versions no longer require these two functions.
Runbook Properties
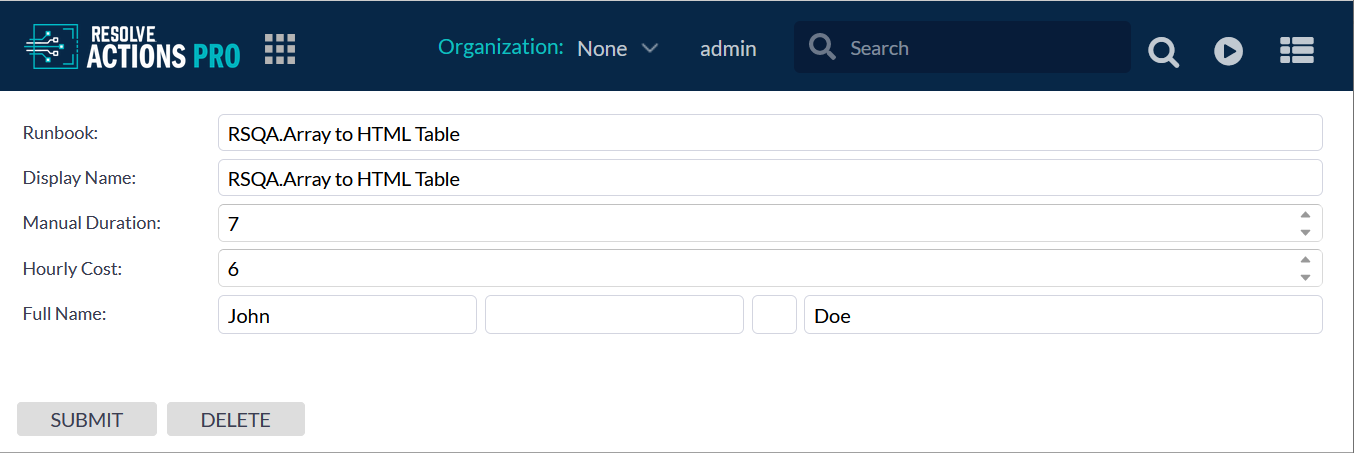
The Runbook Properties menu item brings up the "Runbook Properties List", which keeps track of the runtime properties of each Runbook. The properties include the Runbook duration (in minutes) when executed, listed in the column "Manual Duration". It also includes the hourly cost (in dollars) associated with executing the Runbook given by the column "Hourly Cost". The Runbook properties are used when generating the Business Reports for all the Runbooks executed in Actions Pro.
To create or delete a Runbook property:
- Select the desired property located at the top of the list. Click the New and Delete buttons, respectively.
- To edit a Runbook property, click the More Information icon listed next to the Runbook property.
- Editing or creating a Runbook property brings up the Runbook Properties edit screen. The Runbook duration and hourly cost value must be manually input.
- The Runbook properties are saved into the database after clicking the "SUBMIT" button.
Metric Thresholds (MCP)
The RSMgmt component of Actions Pro supports and collects a wide variety of metrics. These metrics are grouped together into several categories;
- Java virtual machine (JVM) statistics
- database statistics
- server load statistics
- Runbook execution statistics.
Actions Pro measures and collects the metrics to create Admin Reports that provide users with information on how Actions Pro is functioning at any given time period.
Also included in Report Administration are user-defined metric thresholds, which alert the user during system variability. When a metric data value exceeds a threshold value, the user is notified to take precautionary measures to stabilize the system. For example, a metric threshold can be defined such that when the memory available in the JVM drops below a threshold value of 10% of total memory, the user is notified to increase the amount of memory.
Deploying Metric Thresholds
All default values of metric thresholds are deployed in all components of Actions Pro. The changes can be configured from the MCP (Master Control Process) menu item in the Report Administration main menu.
- The "Metric Servers List" shows the metric servers available in the system, with the components active within each server listed beneath each server.
- The "Type" field represents the component name, the "Address" field represents the IP address, and the "GUID" field represents the unique GUID of the component.
- Each server component in the "Metric Servers List" shows the deployed metric thresholds by "Name", "Group", and "High" and "Low" thresholds for that specific component. Notifications about crossing thresholds can be viewed in the Alert Log, under the System Logs main menu.
Copying Threshold Rules
You can set the following options when copying a threshold rule:
Command | Description |
Module | Assigns the package that the rules belong to. |
Name | The threshold rule name assigned. |
Active/Auto Deploy | Checkbox: Activates or auto deploys the functions. |
Severity |
|
Actions | The following options are available:
|
Metric Group | The following options are available:
|
Metric Name | The following options are available:
|
Source (optional) | The Source is a combination of the host name, service name, and the component GUID from which the metric is derived. A regular expression can be used to match only one of these values. The source should be in the form of <hostname>.<servicename>/<guid>.
|
Conditions | |
Add | Adds the conditions. |
Clear | Deletes the conditions. |
Create/Create a Version | Activates all the entries or you can create several versions with unique names. |
Cancel | Ends session |
Create with Version | Allows you to create a version by copying and modifying an existing version. |
Creating Threshold Rules
You can set the following options when creating a threshold rule:
Command | Description |
Module | Assigns the package that the rules belong to. |
Name | The threshold rule name assigned. |
Active/Auto Deploy | Checkbox: Activates or auto deploys the functions. |
Severity |
|
Actions | The following options are available:
|
Metric Group | The following options are available:
|
Metric Name | The following options are available:
|
Source (optional) | The Source is a combination of the host name, service name, and the component GUID from which the metric is derived. A regular expression can be used to match only one of these values. The source should be in the form of <hostname>.<servicename>/<guid>.
|
Conditions | |
Add | Adds the conditions. |
Clear | Deletes the conditions. |
Create/Create a Version | Activates all the entries or you can create several versions with unique names. |
Cancel | Ends session |
Create with Version | Allows you to create a version by copying and modifying an existing version. |
Deploying Threshold Rules
To change and deploy the new metric threshold values:
- Select the component(s) on which the new thresholds have to be deployed.
- Click the "Deploy" button available at the top of the list. The button pops a new window showing the Deploy Metrics screen, which lists all the default thresholds.
Admin
Admin module simplifies the configuration of MCP (Master Control Process) so that MCP can build up and organize the collection of cluster/host/instances that it needs to manage. User also uses the Admin module to manage users and associated privileges.
Host Setup
Before MCP can monitor and administer any Actions Pro instance, it needs to know about the instance. User needs to supply MCP with the host information and proper SSH credential of a Actions Pro host, and installation paths of Actions Pro instances. In addition, user should supply a Actions Pro user that has sufficient privilege to perform actions. To minimize the work required to set up an instance, MCP should automatically gather as much information as possible. Currently, the Blueprint files hold the configuration details for a particular Actions Pro host. MCP should fetch and extract as much information out of the Blueprint files as possible. The administrator can fill in the missing info if necessary.
Host Organization
Multiple Actions Pro components make up a Actions Pro instance. One or more Actions Pro instance(s) can run on a host. One or more hosts can form a cluster. A cluster can be labeled with a group. Most of information should be pulled in during the host setup. But user can further customize the view to fit his need.
User Management
MCP users are separate from the user of the Actions Pro instances that it manages. Some are operator of MCP that can monitor and operate on a host. Some are administrator of MCP that can configure host and user information. User's privilege will be granted based on his group and role, on per app basis.
CLUSTERNAME=resolve_reena
# MCP registration
rsmgmt.mcp.registration.enabled=true
rsmgmt.mcp.registration.password=ENC1:cvRtQyJs4w9m+pDNi3KW/w==
rsmgmt.mcp.registration.port=8080
rsmgmt.mcp.registration.protocol=http
rsmgmt.mcp.registration.username=admin
rsmgmt.mcp.registration.uri=COVMDEV247.RESOLVESYS.COM
C:\project\resolve\dist\rsconsole\bin>run

RSConsole [Version 5.3.0 Beta]
(C) Copyright 2015 Resolve Systems, LLC
Username: admin
Password: ********
*
RSCONSOLE started ...
#/> connect rsmgmt
Connecting with secure network...
Connect session: RSMGMT
RSMGMT#/> ls
cluster/
config/
control/
cron/
gateway/
impex/
index/
info/
install/
internal/
license/
mcp/
metric/
mgmt/
runbook/
social/
RSMGMT#/> cd mcp
RSMGMT#/mcp> ls
DeregisterFromMCP.groovy
RegisterWithMCP.groovy
RSMGMT#/mcp> DeregisterFromMCP.groovy
Example commands:
DeregisterFromMCP -Uri 125.11.126.21 -u admin -p myPassword -cluster myResolveCluster
DeregisterFromMCP –Uri mcp.servername.com -u admin -p myPassword -protocol https -port 8443 -hostname myResolveHost -cluster myResolveCluster
RegisterWithMCP -Uri COVMDEV247.RESOLVESYS.COM -u admin -p resolve
RSMGMT#/mcp> Registerwithmcp
Example commands:
RegisterWithMCP -Uri 125.11.126.21 -u admin -p myPassword
RegisterWithMCP –Uri mcp.servername.com -u admin -p myPassword -protocol https -port 8443
If using https, be sure that the run.bat/run.sh file for rsconsole includes the following truststore parameter in JAVA_OPTS:
-Djavax.net.ssl.trustStore="path to keystore file here"
Integrating with Reporting Platforms
As detailed in Usage Reports, you can get a few different types of Runbook execution reports in a CSV format. If, however, you want to bring the data into a third-party reporting platform, you can do that by reading the data directly from the Actions Pro SQL database.
Configuring Actions Pro to provide data for a third-party reporting platform involves loading reporting data either manually or through a scheduled job.
After you configure Actions Pro, the reporting data is stored in the RUNBOOK_EXE_SUMMARY SQL database table. Configuring your preferred reporting platform to read and output data from the table is outside the scope of this document.
The stored reporting data automatically excludes any Runbooks in the Reports namespace which are used for report generation.
Scheduled Data Loading
Actions Pro installs a scheduled job that adds data about all Runbook executions to the database on a daily basis. It is active immediately after the installation.
You are free to change the job's schedule although it is not recommended to run the job less frequently than daily because it is preconfigured to add only the last 24-hours' worth of execution data. If you run it every two days, for example, the database will only reflect the data from the second day.
Take these steps to reconfigure the scheduled job:
- From the Actions Pro main menu, go to System Administration > Job Scheduler.
- Click the View Details icon in front of the
RUNBOOK_EXE_SUMMARYjob. - Ensure that the Active check box is selected.
- In the Schedule section, use the controls to create a run schedule.
The recommended schedule is daily at 23:59:59. - Optionally, in the Time Range section, set an end date for the last job run.
It is not recommended to set a start time in the future because this could cause reporting data generated between the initial loading time and the selected start time to be missing from your reporting platform. - Click Save.
Manual Data Loading
In addition to the scheduled loading, you can also do one-time reporting data loading. It allows you to load multiple days of data for all or for selected Runbooks. It can be helpful during the initial reporting platform setup or later if you need to load data that the platform does not have. You can run the initial loading as much times as you need.
The initial data loading replaces any pre-existing data that might have been present in the RUNBOOK_EXE_SUMMARY database table for the selected Runbooks. Data for other Runbooks remains intact.
Take these steps to do the initial data loading:
- From the Actions Pro main menu, go to Reports Administration > Store Execution History.
- In the tabular view in the upper left corner, select one or more Runbooks that you want to track in your reporting platform.
Use the Execution Status check boxes on the right to select what types of reports the tabular view will show. - Use the From and To date pickers to select the time period that you want to load data for.
- Click Run.
Unless you have a corner case in mind, it is always recommended to select the today's date as To date. If you select an earlier date, you risk losing the data aggregated by the scheduled job for the time period between that date and today's date, as all existing data for the selected Runbooks is overwritten.
Business Reports
There are several types of business reports available to assist you in presenting the data.
Runbook Saving Reports
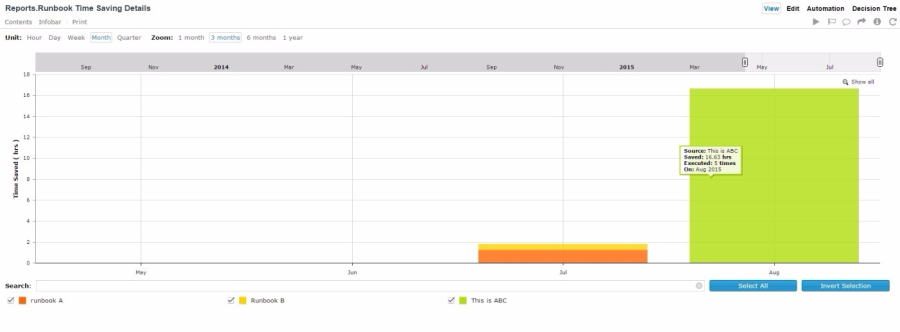
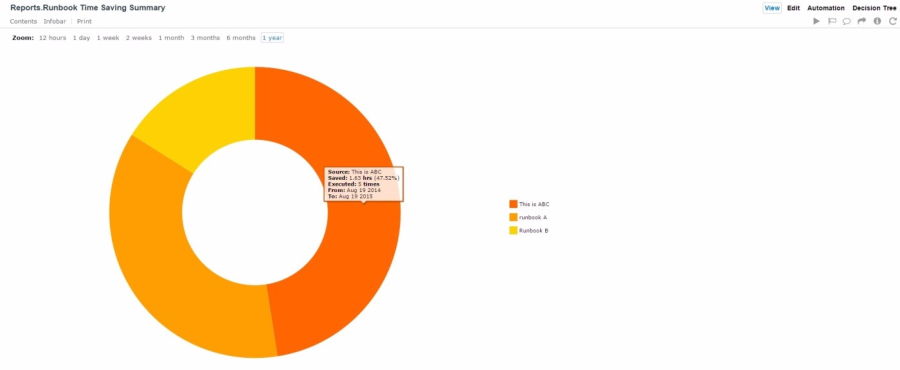
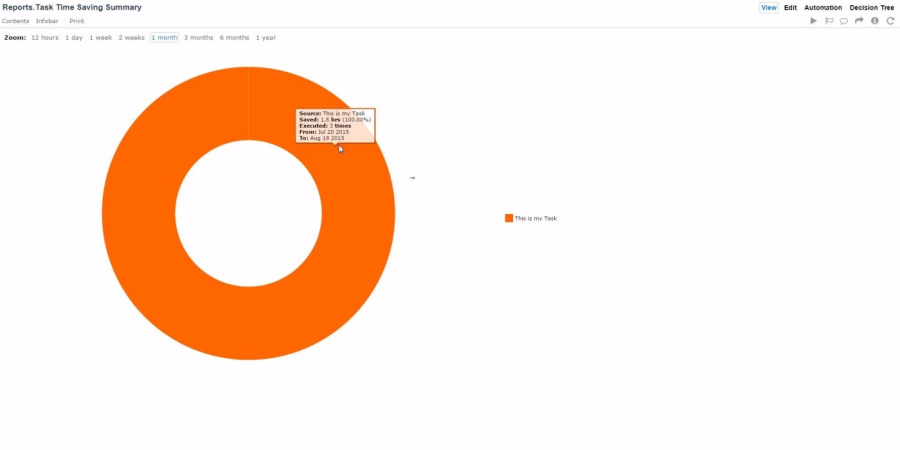
Time Saved
A Runbook saves time by automating tasks that would take a person much longer to execute. These reports show the time saved in hours due to an automatic execution of Runbooks, in comparison to manual execution of each Runbook, over a time period set by the Unit and Zoom scales.
- Each report has two types of graph formats; chart (shown first), pie (selected).
- Unit: This setting can be toggled to the hour, day, week, or month.
- Zoom: It can be toggled by the 1, 3, 6, or 12 months.
Each graph shows the following:
- Time Saved Detail: This stacked column format displays the time saved in hours due to Runbook automation. It represents:
- the total time saved in hours
- the sum of time saved per Runbook for all the Runbooks executed in a period of time
- Time Saved Summary: This pie chart illustrates the percent of total time saved by each Runbook due to Runbook automation. Each sector in the pie chart represents the name of the Runbook and the name of the Runbook and the percentage of time saved by a single or multiple Runbook execution(s) on a specific date.
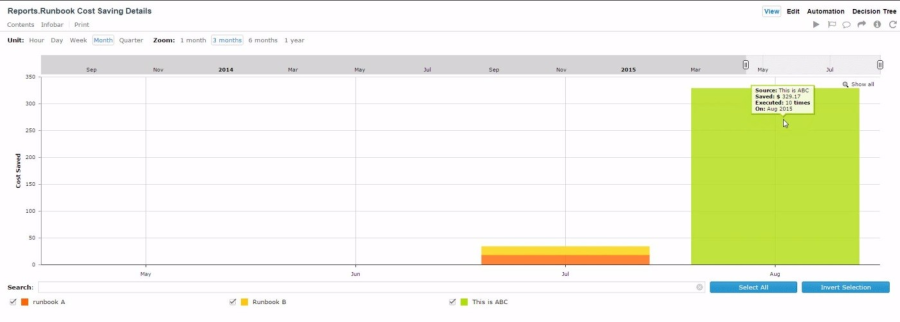
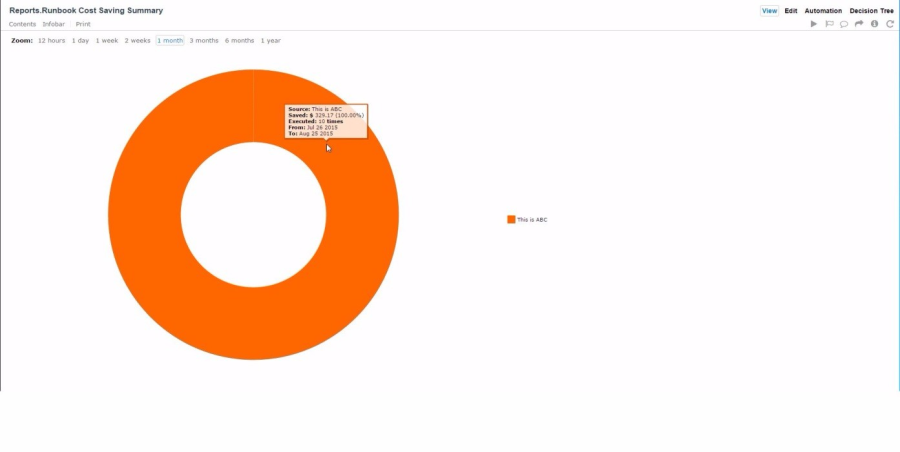
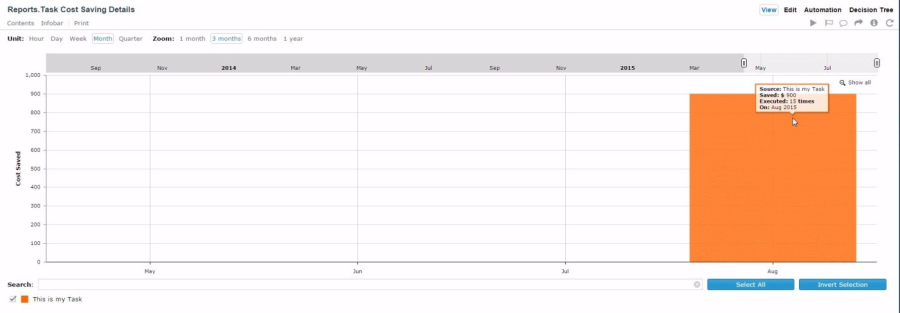
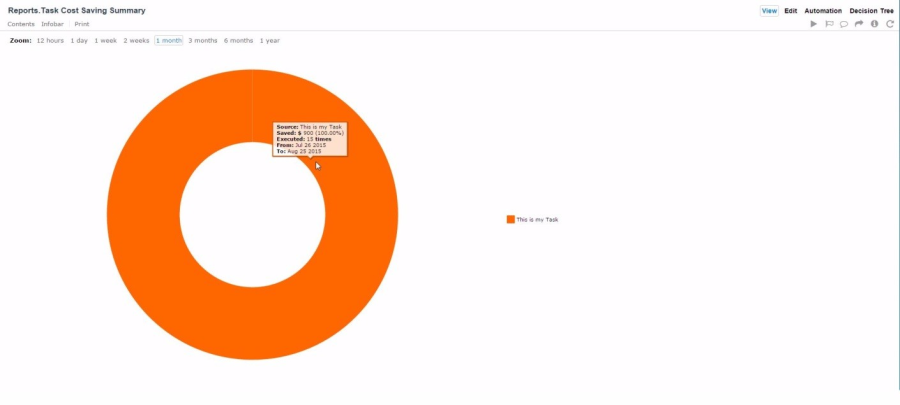
Cost Saved
Cost-Saved reports show the amount of money saved per hour due to Runbook automation over the time period set by the Unit and Zoom scales.
- Each report has two types of graph formats; chart (shown first), pie (selected).
- Unit: This setting can be toggled to the hour, day, week, or month.
- Zoom: It can be toggled by the 1, 3, 6, or 12 months.
- Each sector in the chart represents the name of the Runbook as Wiki and the percentage of the total cost saved by a single or multiple Runbook execution(s) on a specific date.
- The cost-saved summary report monitors the costs saved due to Runbook automation over the displayed time period.
Each graph shows the following:
- Cost Saved Detail: It displays the cost saved in dollars due to Runbook automation. Each stacked column chart represents the total cost saved in dollars, which is the sum of costs saved per Runbook, for all the Runbooks executed in a time period.
- Cost Saved Summary: The cost saved summary pie chart illustrates the percentage of the total dollar amount saved by each Runbook. Each sector in the pie chart represents the name of the Runbook as Wiki and the percentage of the total dollar amount saved by either single or multiple Runbook execution(s) on a specific date.
ActionTask Saving Reports
There are several types of Action Task savings reports available to assist you in presenting the data.
Time Saved
Action Tasks are building blocks of Runbooks and are similar to a Runbook. By automating a task you save the time it would take a person manually execute each task.
- Each report has two types of graph formats; chart (shown first), pie (selected).
- Unit: This setting can be toggled to the hour, day, week, or month.
- Zoom: It can be toggled by the 1, 3, 6, or 12 months.
- The time-saved summary report monitors the difference between action task execution time and manual execution time and displays the savings.
Each graph shows the following:
- Time Saved Detail: The time saved detail graph displays the time saved in hours due to Action Tasks automation. Each stacked column chart represents the total time saved, which is the sum of time saved per Runbook, for all the Runbooks executed in a period of time.

- Time Saved Summary: This pie chart illustrates the percent of total time saved by each Runbook due to Action Tasks automation. Each sector in the pie chart represents the name of the Runbook and the name of the Runbook and the percentage of time saved by a: xxxxx
Cost Saved
Closely connect with cost saved, a labour rate can be configured to calculate the monetary saving from the time saving.
- Each report has two types of graph formats; chart (shown first), pie (selected).
- Unit: This setting can be toggled to the hour, day, week, or month.
- Zoom: It can be toggled by the 1, 3, 6, or 12 months.
- The cost-saved summary report monitors the difference between action task execution cost and manual execution cost and displays the savings.
Each graph shows the following:
- Cost Saved Detail: It displays the cost saved in dollars due to Runbook automation based on time. Each stacked column chart represents the total cost saved in dollars, which is the sum of costs saved per Runbook, for all the Runbooks executed in a period of time.
- Cost Saved Summary: The cost saved summary pie chart illustrates the percentage of the total dollar amount saved by each Runbook. Each sector in the pie chart represents the name of the Runbook as Wiki. Closely connect with time saved, a labor rate can be configured to calculate the monetary saving from the time saving.
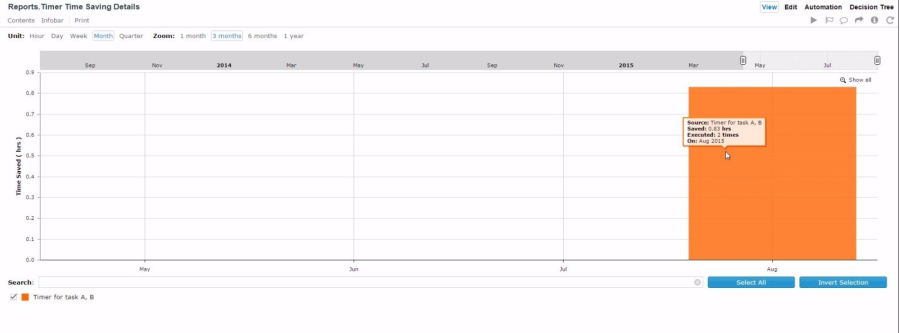
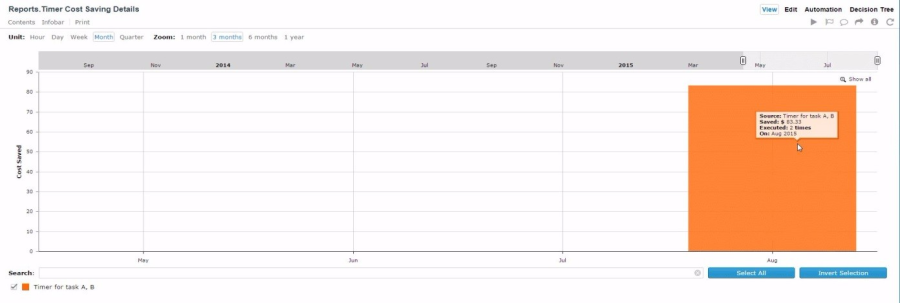
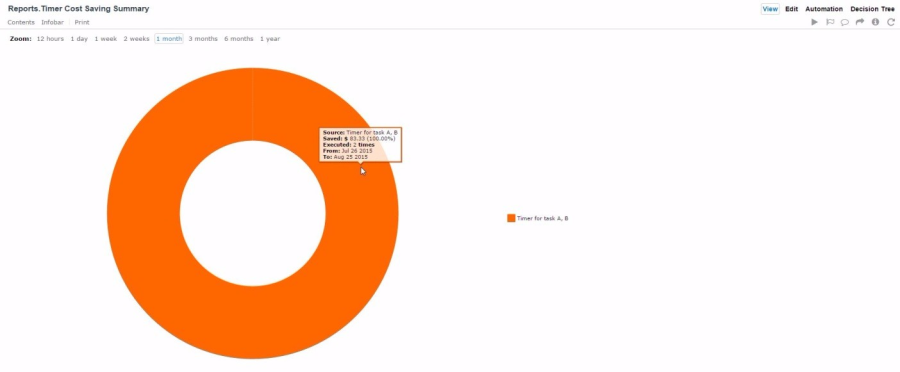
Timer Saving Reports
Time Saved
Timer defines a section of a Runbook for specific measurement. A section can contain one or more Action Tasks or Sub-runbooks, or both. The difference between the time it takes to complete execution of all elements bounded by a timer, and time that would have taken a person to accomplish the set, is the saving measured by a timer.
- Each report has two types of graph formats; chart (shown first), pie (selected).
- Unit: This setting can be toggled to the hour, day, week, or month.
- Zoom: It can be toggled by the 1, 3, 6, or 12 months.
Each graph shows the following:
- Time Saved Detail: This displays the time saved in hours due to Action Tasks or Sub-runbooks, or both. Each stacked column chart represents the total time saved to complete execution of all elements within a specific set time-frame, compared to manual execution.
- Cost Saved Summary: This pie chart illustrates the total time saved to complete execution of all elements within a specific set time-frame, compared to manual execution. It uses the name of the Runbook as Wiki.

Cost Saved
Cost-Saved reports show the amount of money saved per hour due to Runbook automation over the period of time set by the Unit or Zoom scales. Closely linked with time saved, a labour rate can be configured to calculate the monetary saving from the time saving.
- Each report has two types of graph formats; chart (shown first), pie (selected).
- Unit: This setting can be toggled to the hour, day, week, or month.
- Zoom: It can be toggled by the 1, 3, 6, or 12 months.
- Each sector in the chart represents the name of the Runbook as Wiki and the percentage of the total cost saved by a single or multiple Runbook execution(s) on a specific date.
- The cost-saved summary report monitors the costs saved due to Runbook automation over the displayed time period.
Each graph shows the following:
- Cost Saved Detail: It displays the cost saved in dollars due to Runbook automation. Each stacked column chart represents the total cost saved in dollars, which is the sum of costs saved per Runbook, for all the Runbooks executed in a period of time.
- Cost Saved Summary: The cost saved summary pie chart illustrates the percentage of the total dollar amount saved by each Runbook. Each sector in the pie chart represents the name of the Runbook as Wiki
Operation Reports
Runbook Reports
Runbook Execution
Runbook Execution shows the trend of the number of runbooks executed per day. To know how executions stack against their Conditions, Severity, and Status, refer to Execution Details. To know the number of execution grouped by runbooks, refer to the Execution Summary. To look for runbooks that could be target for optimization, look into Runbook Duration.
- Each report has two types of graph formats; chart (shown first), pie (selected).
- Unit: This setting can be toggled to the minutes, hour, or day.
- Zoom: It can be toggled by the 1, 6, 12, or 24 hours.
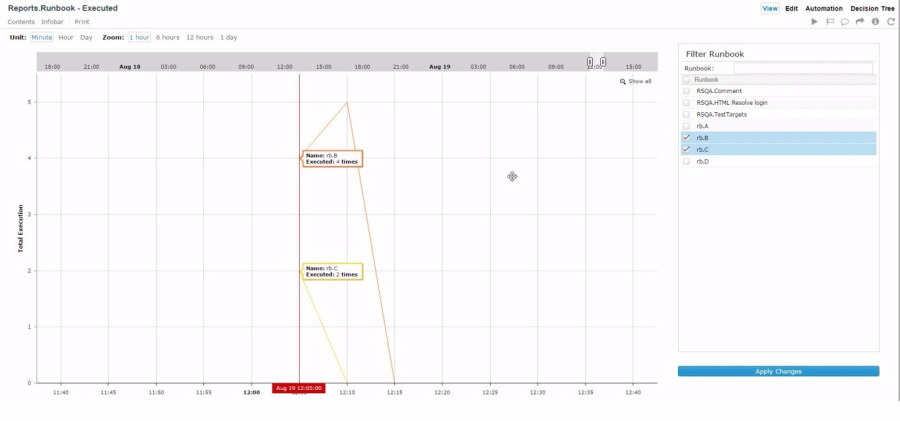
Reports Runbook Executed
The bar chart displays:
- The vertical axis lists the total Runbooks executed. The horizontal axis is date/time.
- The user can filter the data to see any Runbook from the selection list.
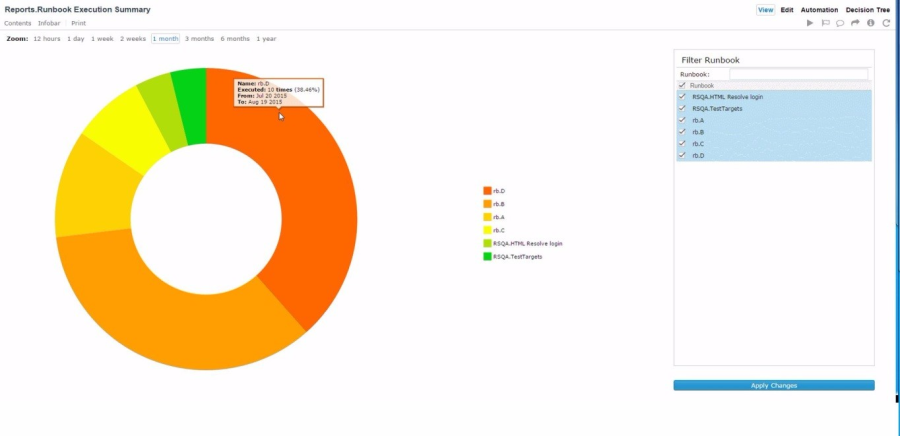
Runbook Execution Summary
The Execution Summary reports show the percentage of total number of executions for each Runbook. Each sector in the pie chart represents the Runbook name and percentage of total execution count of all Runbooks in that time period.
- Zoom: set to 12 hours, 1 day, 1 or 2 weeks, or 1/3/6/12 months.
- Filter Action Tasks: The user can filter the Runbook(s) from the selection list.
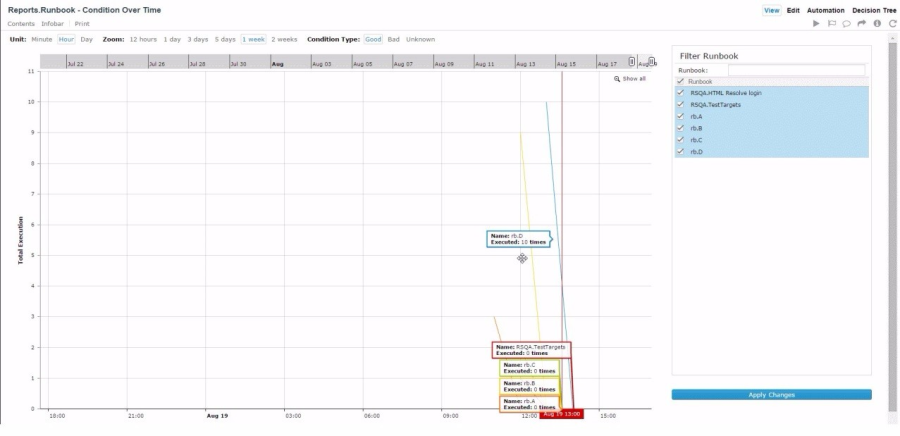
Runbook Condition Over Time
This report illustrate the total count for all Runbook executions in a period of time. The bar chart displays:
- The vertical axis lists the total Runbooks executed. The horizontal axis is date/time..
- Unit: This setting can be toggled to the minutes, hour, or day.
- Zoom: set to 12 hours, 1 day, 1 or 2 weeks.
- Condition type: can be set to good, bad, or unknown.
- Filter Runbook: The user can filter the Runbook(s) from the selection list.

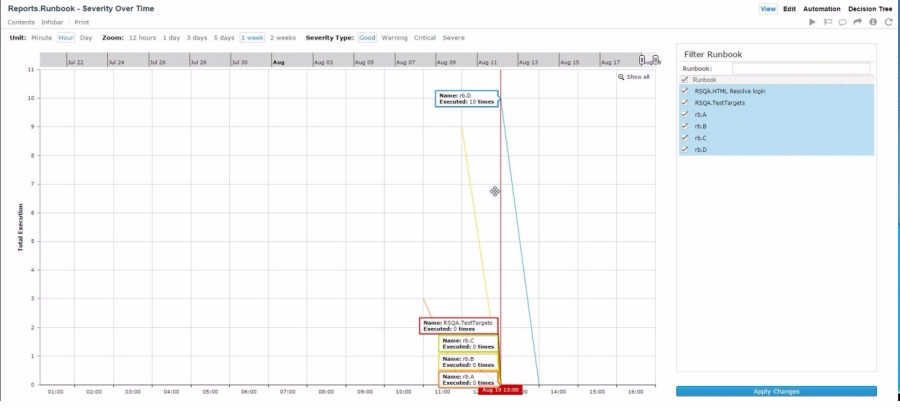
Runbook Severity Over Time
The report shows:
- The vertical axis lists the total Runbooks executed. The horizontal axis is date/time..
- Unit: This setting can be toggled to the minutes, hour, or day.
- Zoom: set to 12 hours, 1 day, 1 or 2 weeks.
- Severity Type: can be set to good, warning, critical, or severe.
- Filter Runbook: The user can filter the Runbook(s) from the selection list.
Runbook Duration
This report illustrates average execution duration of runbooks.
- The vertical axis lists the average execution duration in seconds. The horizontal axis is date/time.
- Unit: This setting can be toggled to the minutes, hour, or day.
- Zoom: set to 12 hours, 1 day, 1 or 2 weeks.
- Filter Runbook: The user can filter the Runbook(s) from the selection list.
Knowledge Reports
Knowledge and Guided Procedure
Wiki pages and guided procedures assist with cases not covered by automation. The top used knowledge and guided procedures show what users use most and may deserve additional attention for reviewing and optimization.
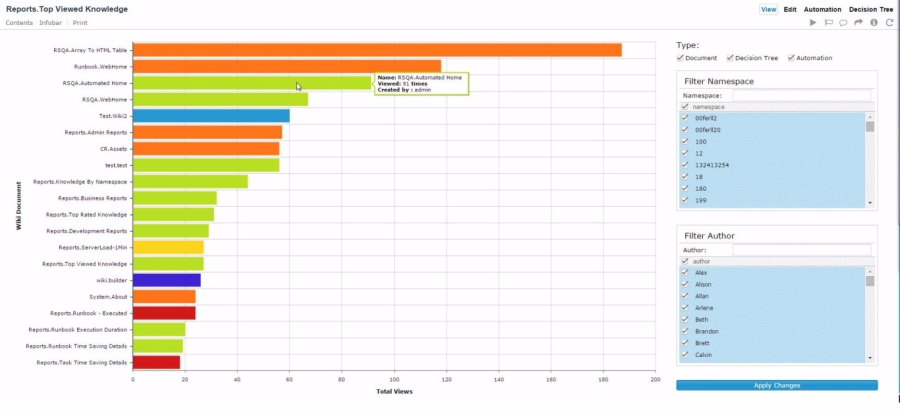
Top Viewed Knowledge
The bar chart displays:
- The vertical axis lists the name of the Wiki documents while the horizontal axis shows the total views.
- The user can filter the data to see;
- Document
- Decision Tree
- Automation
And filter namespaces, and authors of documents from the selection list.
Top Decision Trees
The graph displays:
- The vertical axis lists the name of the decision trees while the horizontal axis shows the total executions.
- You can filter namespaces or authors of documents from the selection list.

JVM
Memory utilization and thread count in JVM show the stress level in available resources. It has high risk of system failure from:
- High memory utilization or high thread count means system is under heavy load
- An issue reclaiming resource
The JVM metric reports illustrate the performance monitoring on your Java virtual machines.
- The "Allocated Memory" chart represents the thread count for each Actions Pro component.
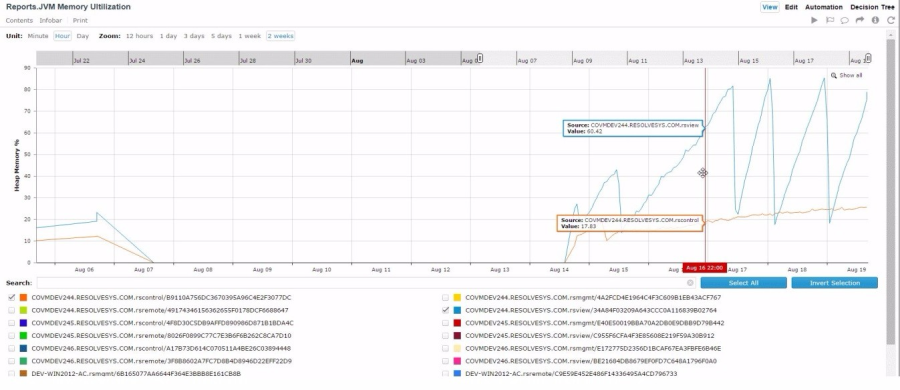
- The "Thread Count" chart represents the percentage of JVM memory allocated for each Actions Pro component.
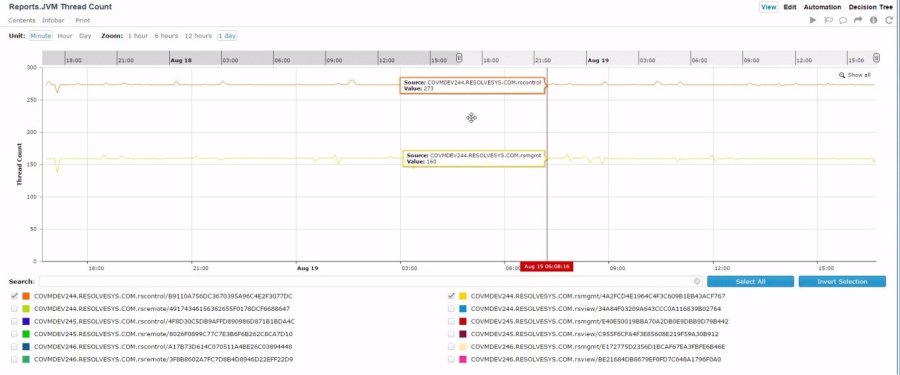
- Unit: This setting can be toggled to the minutes, hour, or day.
- Zoom: set to 12 hours, 1 day, 1 or 2 weeks.
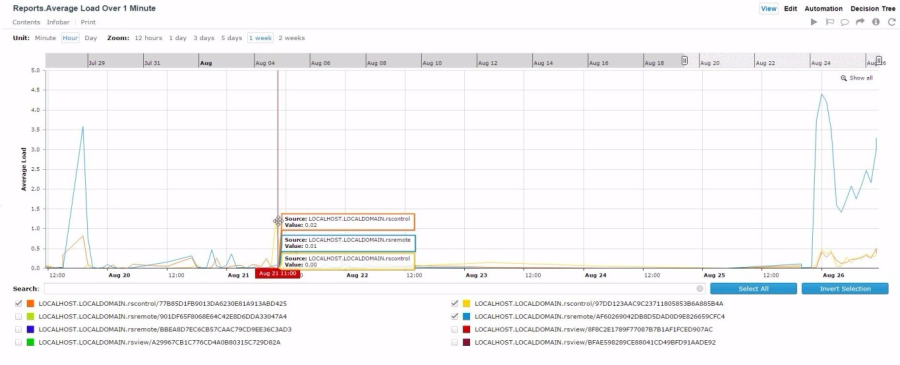
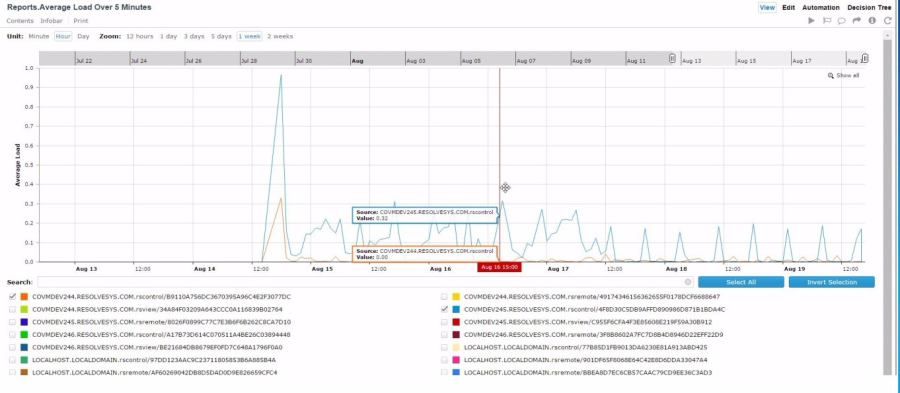
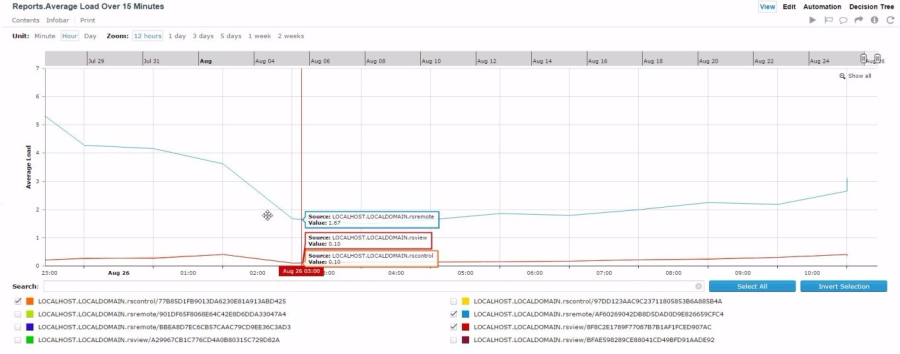
Load
Load level, measured over various intervals, shows how busy Actions Pro is processing events, and is a good indicator of whether sufficient CPUs have been provisioned for the job. Sustained high load could mean system is overstretched, or some Runbook consumes too much resources and may need to be optimized. The Linux/Unix Server metric reports illustrate the average system load over a period of time. For UNIX servers, the system load conventionally appears as the average load taken over 1, 5, or 15 minute intervals.
- Unit: This setting can be toggled to the minutes, hour, or day.
- Zoom: set to 12 hours, 1 day, 1 or 2 weeks
The following figure shows average load over 1 minute:
The following figure shows average load over 5 minutes:
The following figure shows average load over 15 minutes:
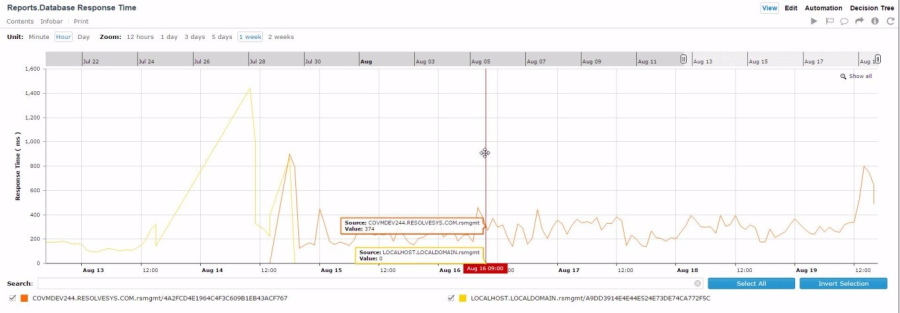
Database
Database stores critical assets such as Runbook and Worksheets. If the size is growing too large or response time is slowing down, it may indicate that database server is under-provisioned or more connections are needed. The Database metric reports illustrate the performance monitoring on your database schema.
- Unit: This setting can be toggled to the minutes, hour, or day.
- Zoom: set to 12 hours, 1 day, 1 or 2 weeks.
The following figure shows the database size.

The following figure shows the database response time.
Execution Reports
Runbook
Execution Reports shows detailed information on Runbooks executed by Actions Pro. It contains the:
- Number of Runbooks started, finished, or aborted
- Delays in starting execution
- Time required to complete an execution
This data highlights work performed and potential areas for optimization. These metric reports illustrate several types of Runbook execution statistics:
Executed
Total number of Runbooks executed over a given time period;
- The vertical axis lists the total executions. The horizontal line is incremented in hours or days.
- Unit: This setting can be toggled to the minutes, hour, or day.
- Zoom: set to 12 hours, or 1 day.

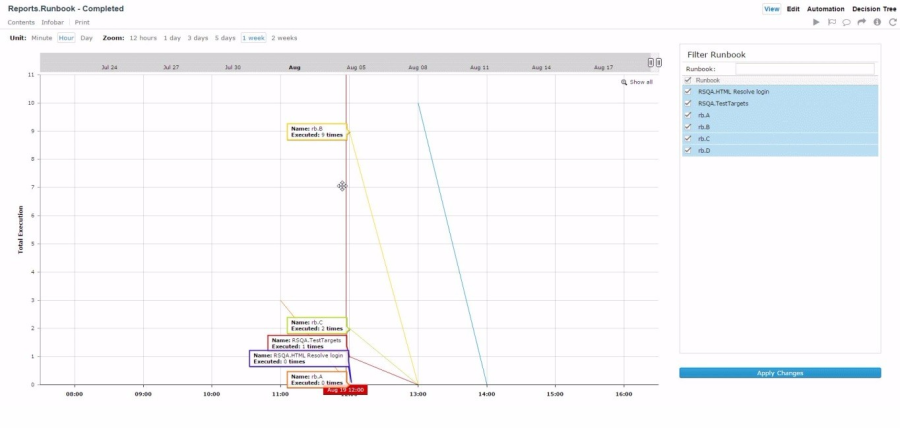
Completed
Total number of Runbooks completed over a given time period.
- The vertical axis lists the total executions. The horizontal line is incremented in hours or days.
- Unit: This setting can be toggled to the minutes, hour, or day.
- Zoom: set to 12 hours, 1 day, 1 or 2 weeks.
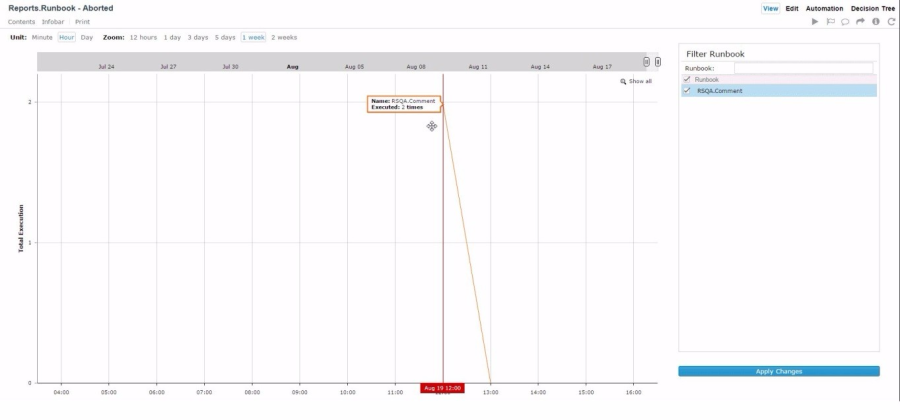
Aborted
Total number of Runbooks aborted over a given time period.
- The vertical axis lists the total executions. The horizontal line is incremented in hours or days.
- Unit: This setting can be toggled to the minutes, hour, or day.
- Zoom: set to 12 hours, 1 day, 1 or 2 weeks.
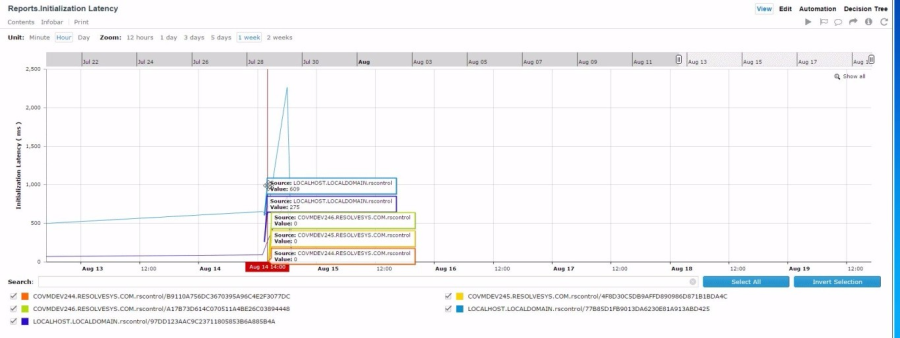
Initialization Latency
The vertical axis lists the initialization latency in mili-seconds. The horizontal line is incremented in hours or days.
- Unit: This setting can be toggled to the minutes, hour, or day.
- Zoom: set to 12 hours, 1 day, 1 or 2 weeks.
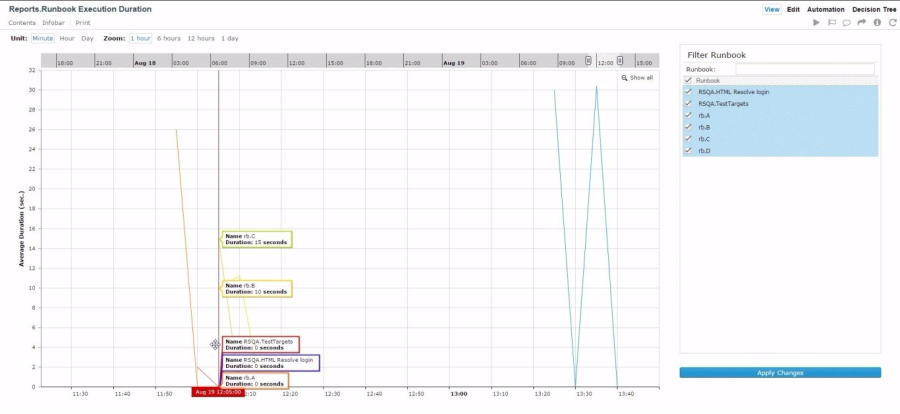
Execution Duration
This will show the average duration (in seconds) of all Runbooks in a given time period.
- The vertical axis lists the average duration in seconds. The horizontal line is incremented in hours or days.
- Unit: This setting can be toggled to the minutes, hour, or day.
- Zoom: set to 12 hours, 1 day, 1 or 2 weeks.

Page
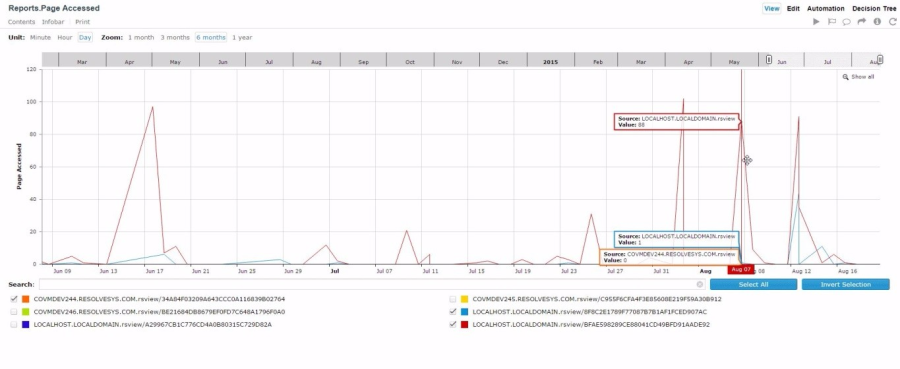
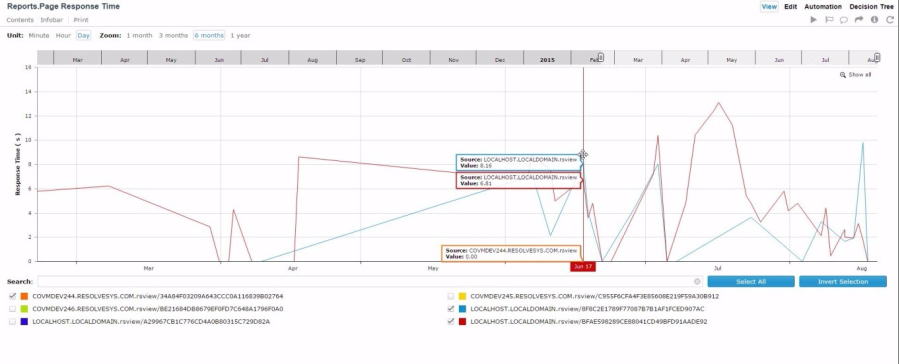
Page (Wiki) is another important feature. The reports show access count and average latency. This can be used to assess usage of knowledge base, assist with performance profiling, and troubleshooting. The Page metric reports track wiki document page statistics.
Transaction Count
This line graph shows the total number of documents accessed within a given time period.
Response Time
This line graph shows the average time required to fetch and display the document within a given period of time.
Development Reports
Knowledge Management
Knowledge Management (KM) reports track the aging, feedback, and usage statistics of wiki document pages to aid in the organization and administration of document content. Decision tree documents are also reported.
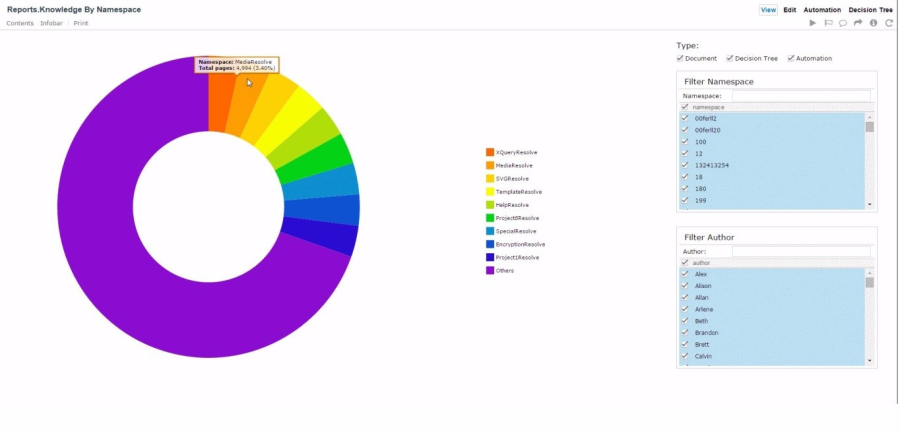
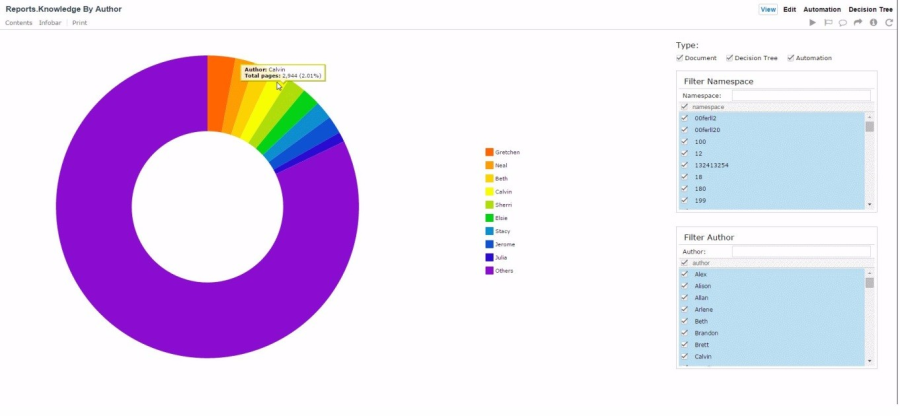
Knowledge Summary
This feature organizes information three ways:
- Knowledge by Namespaces: is grouped by namespaces which often corresponds to functional areas
- Knowledge by Author: who created the knowledge
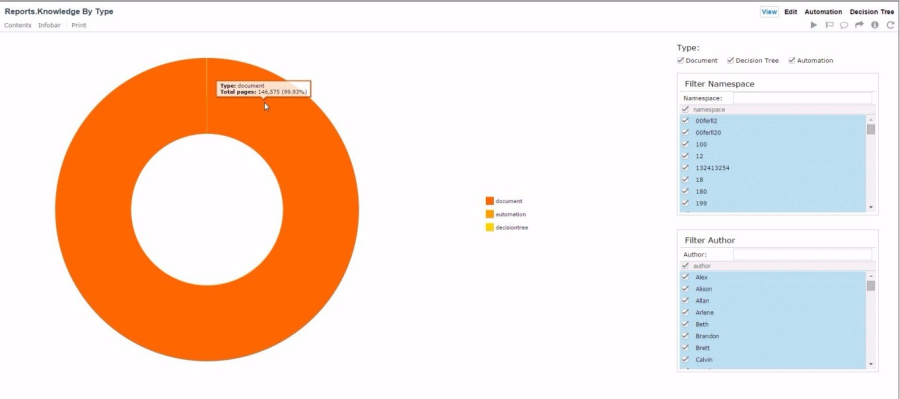
- Knowledge by Type: this is the kind of knowledge such as decision tree, document, automation, etc.
The user can filter the data to see the average rating of the document types:
- Document
- Decision Tree
- Automation
And filter namespaces, and authors of documents from the selection list.
Knowledge by namespaces:
Knowledge by author:
Knowledge by type:
Review and Feedback
The Review and Feedback report lists the Top-10 rated documents over a period of a day, week, month, or year. The report gathers data regarding the Top Rated knowledge to show how knowledge is rated by users. Use the charts to assist with planning review activities to keep knowledge up to date.
- Each report has two types of graph formats; chart (shown first), pie (selected).
- Unit: This setting can be toggled to the hour, day, week, or month.
- Zoom: It can be toggled by the 1, 3, 6, or 12 months.
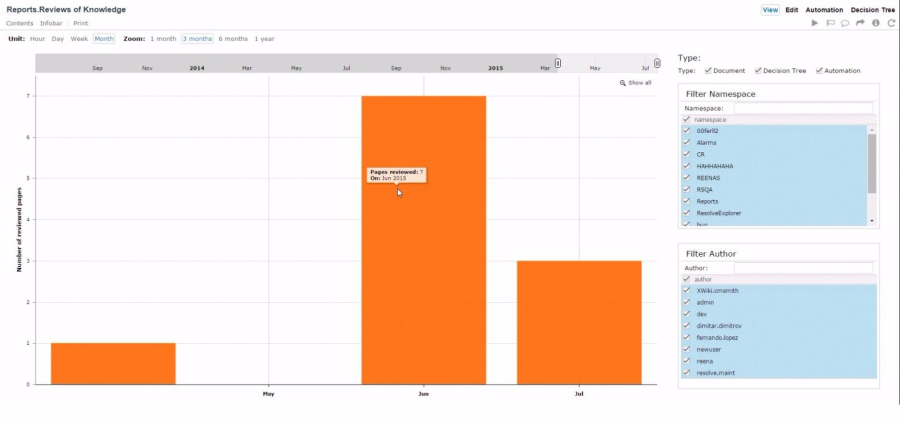
Reviews of Knowledge
The bar chart displays:
- The vertical axis lists the name of the document while the horizontal axis shows the timeframe.
- The average rating of the top documents (with number of documents displayed selected by the user). The user can filter the data to see the average rating of the document types, namespaces, and authors of documents from the selection list.
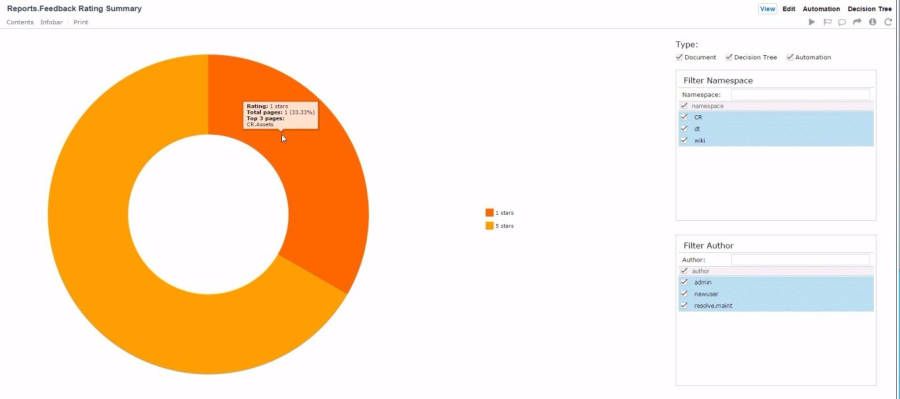
Feedback Rating
This pie chart reports show the rating count for user feedback using a scale of 1 to 5 per document.
- The chart displays the rating scale as a percentage of the chart by color.
- The user can filter the data to see the average rating of the document types, namespaces, and authors of documents from the selection list.
Knowledge Usage Reports
Knowledge and Guided Procedures
The reports show the most access knowledge and the most executed decision trees. This may help with planning optimization efforts.
Top Viewed Knowledge
The bar chart displays:
- The vertical axis lists the name of the Wiki documents while the horizontal axis shows the total views.
- The user can filter the data to see;
- Document
- Decision Tree
- Automation
And filter namespaces, and authors of documents from the selection list.

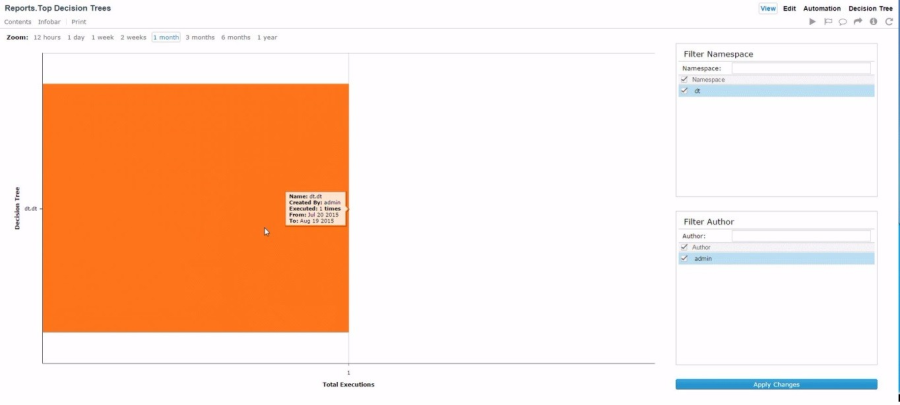
Top Decision Trees
The graph displays:
- The vertical axis lists the name of the decision trees while the horizontal axis shows the total executions.
- You can filter namespaces, and authors of documents from the selection list.
Runbooks
Runbook reports give detailed information on Runbooks executed by Actions Pro. It shows the number of Runbooks:
- Started
- Finished
- Aborted
- Delay in starting execution
- Time required to complete execution
This information shows work performed and potential areas for optimization.
Runbook Execution Duration
The vertical axis lists the Average duration in seconds, while the horizontal axis shows the time frame.
- Unit: This setting can be toggled to the minute, hour, or day.
- Zoom: It can be set to 1, 6, 12 or 24 hours.
- Filter Action Tasks: The user can filter the Runbook(s) from the selection list.

Runbook Execution Summary
This pie chart reports shows:
- The Runbook executions as a percentage of the chart by color.
- Zoom: set to 12 hours, 1 day, 1 or 2 weeks, or 1/3/6/12 months.
- Filter Action Tasks: The user can filter the Runbook(s) from the selection list.

Runbook Condition Over Time
The vertical axis lists the total executions, while the horizontal axis shows the time frame.
- Unit: This setting can be toggled to the minute, hour, or day.
- Zoom: It can be set to 12 hours, 1/3/5 days, 1 or 2 weeks.
- Condition Type: the three selections are Good, Bad, and Unknown.
- Filter Action Tasks: The user can filter the Runbook(s) from the selection list.
Runbook Severity Over Time
The vertical axis lists the Average duration in seconds, and the horizontal axis shows the time frame.
- Unit: This setting can be toggled to the minute, hour, or day.
- Zoom: It can be set to 12 hours, 1/3/5 days, 1 or 2 weeks.
- Severity Type: the selections are Good, Warning, Critical, and Severe.
- Filter Action Tasks: The user can filter the Runbook(s) from the selection list.

Decision Trees
This feature provides insights to improving the process. The charts show the count and details of path executed, completed, and aborted. The duration information can assist with optimization planning as well.
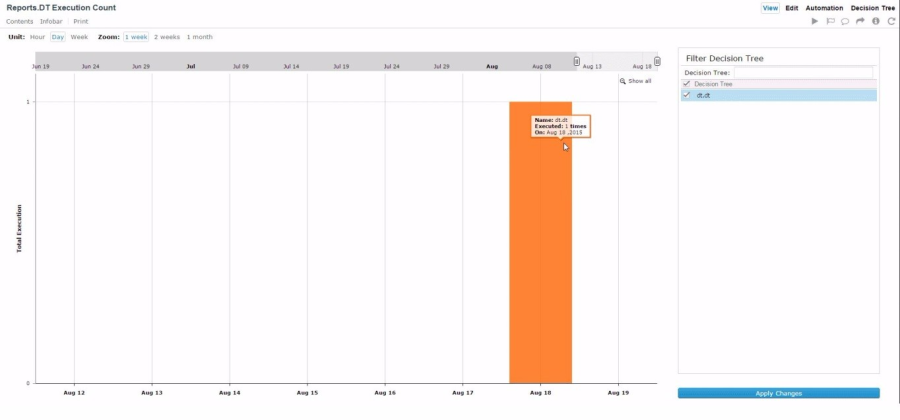
DT Execution Count
The graph displays:
- The vertical axis lists the total executions, while the horizontal axis lists the number of times this document was executed
- The user can choose the execution intervals.
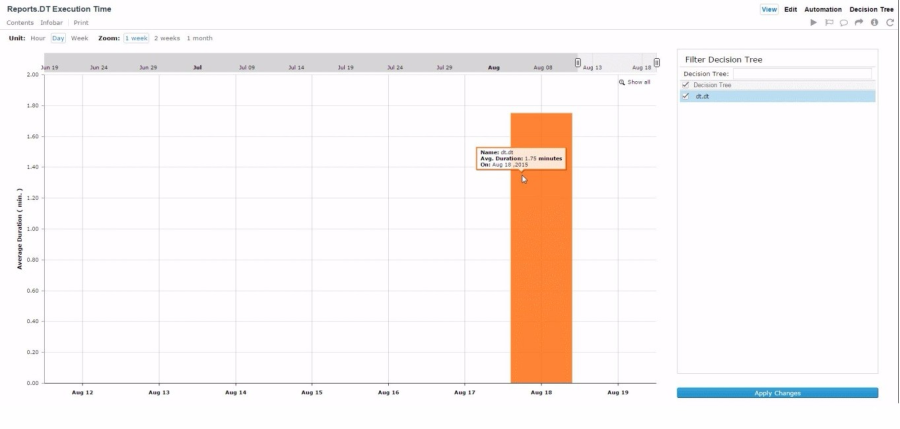
DT Execution Time
The graph displays:
- The vertical axis lists the total executions, while the horizontal axis lists the number of times this document was viewed.
- The user can pick to see the view count of the DT name, the namespaces, and the users of the DT path from the selection list.
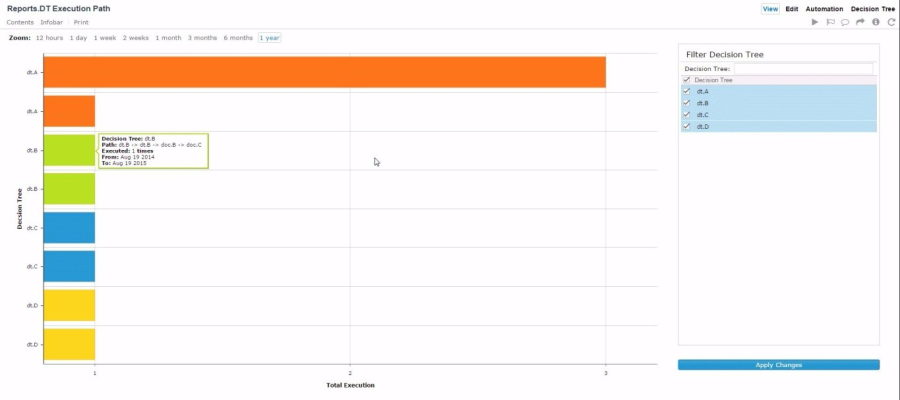
DT Execution Path
The graph displays:
- The vertical axis lists the decision trees, while the horizontal axis lists the total executions.
- The user can pick to see the view count of the DT name, the namespaces, and the users of the DT path from the selection list.
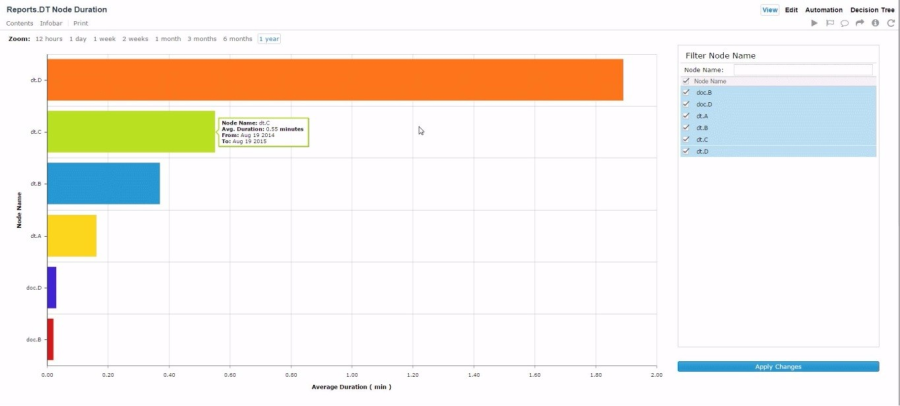
DT Node Duration
The graph displays:
- The vertical axis lists the node name, while the horizontal axis lists the average duration in minutes.
- The user can pick to see the view count of the DT name, the namespaces, and the users of the DT path from the selection list.
ActionTask
Action Tasks are building blocks of Runbooks. They are designed to execute one or several commands, parse the outputs, assess the results, and format the output for easy comprehension.
These reports list the top 10 action tasks executed over a period of a day, week, months, or year.
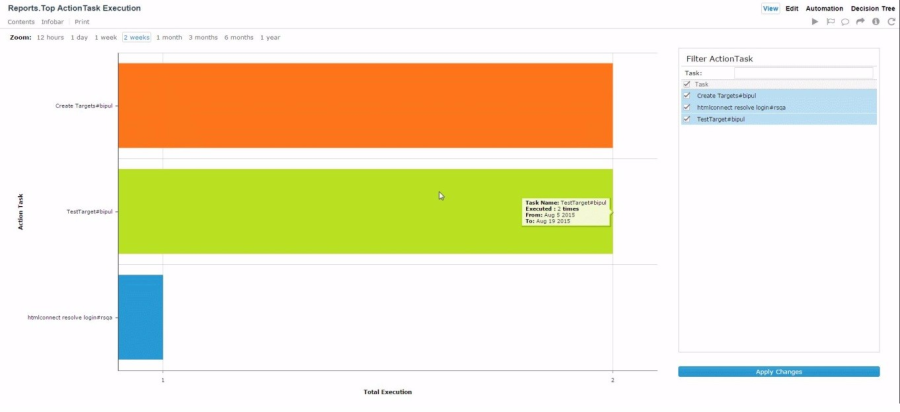
Top Action Task Execution
The vertical axis lists the action tasks, while the horizontal axis lists the total number executed.
- Zoom: It can be toggled by 12 hours, 1 day, 1 or 2 weeks, and 1 3, 6, or 12 months.
- Filter Action Tasks: The user can filter the action task used from the selection list.
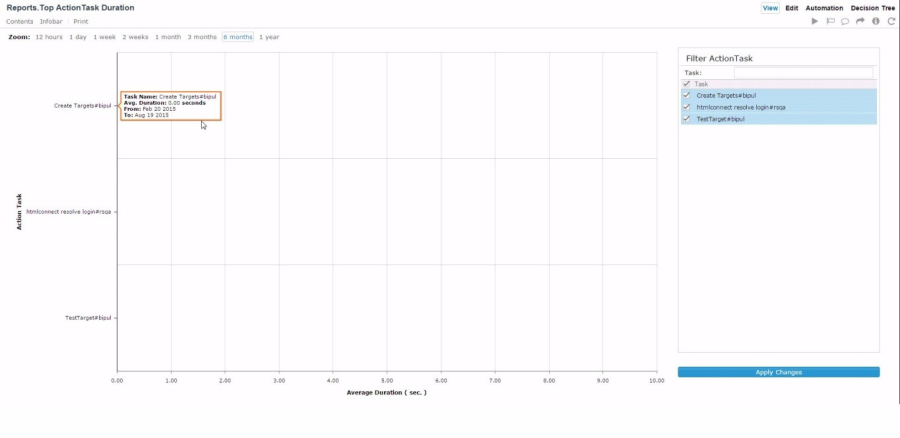
Top Action Task Duration
The vertical axis lists the action tasks, while the horizontal axis lists the average duration in seconds.
- Zoom: It can be toggled by 12 hours, 1 day, 1 or 2 weeks, and 1 3, 6, or 12 months.
- Filter Action Tasks: The user can filter the action task used from the selection list.
Usage Reports
The Usage Reports category provides detailed Runbook usage information such as how the Runbook was run and how many times the critical path was taken. Access these reports by going to Resolve Reports > Usage Reports from the Actions Pro main menu.
Usage reports are generated per Runbook and represent CSV files. See Integrating with Reporting Platforms to learn how to send the same data to a third-party reporting platform that you might use in your organization.
You can request the following report types:
- Execution Report—Provides the details of each automation execution, such as Runbook name, status, created and updated dates, condition, severity, sub-Runbooks, and problem ID. This report is useful in understanding the utilization of your team's automation models.
- Audit Report—In addition to some basic execution details, this report provides execution counts grouped by execution trigger type (guided (manual), scheduled, gateway). This report is useful in understanding the way your team engages with your automation models. It consists of two reports:
- Basic: An aggregate of the automation executions grouped by trigger type. It does not account for the execution status (complete, aborted) and it does not include archived data.
- Detailed: A list of all executions with information such as Runbook name, problem number, created on, and trigger type.
- Critical Path Report—In addition to some basic execution details, this report provides the execution count along the critical path within the automation model. It is useful in understanding the number of times your automation model met a particular objective among other alternatives.
This report type depends on manually marking the critical path as such. See Automation Model Flow Control to learn how to mark the critical path in an automation.
Take these steps to generate a usage report:
- From the Actions Pro main menu, click Resolve Reports > Usage Reports.
- In the tabular view in the upper left corner, select one or more Runbooks that you want to generate a report for.
Use the Execution Status check boxes on the right to select what types of reports the tabular view will show. - Use the From and To date pickers to select the time period to generate the report for.
- In File Name, enter a file name for the generated report.
- Request the report by clicking the respective button:
- Execution Report—Outputs a single CSV file.
- Audit Report—Outputs a pair of similarly named CSV files: a summary report and a detailed report.
- Critical Path Report—Outputs a pair of similarly named CSV files: a summary report and a detailed report.
- Save the generated files on your file system and then use an application that can open CSV files to present the data in a tabular or visual way.
As you generate the different report types, the lower pane populates with tables showing summary execution information.